A new surge of corporate concentration is in process in the United States and abroad, driven in large measure by a restructuring of global markets through mergers and acquisitions (M&As). Announced worldwide merger deals reached $3.4 trillion in 1999, an amount equivalent to 34 percent of the value of all industrial capital (buildings, plants, machinery and equipment) in the United States in 1999. Of this total, nearly a third were cross-border transactions that involved companies based in different countries, up from an average of one-fourth of all mergers during most of the 1990s.1
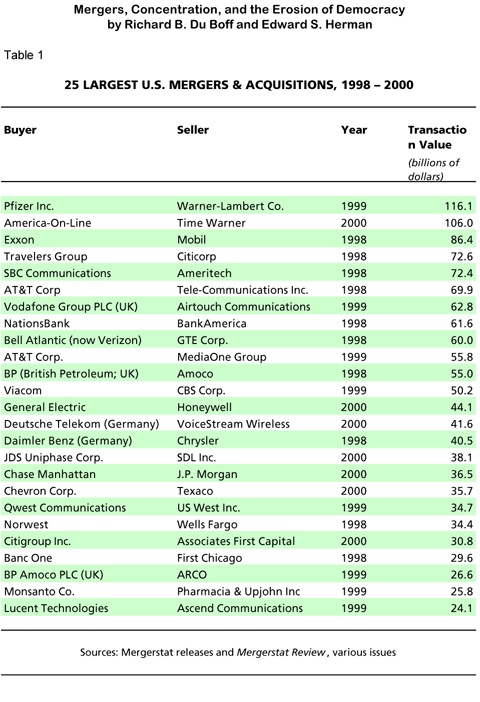
The number of “megamergers”—those with purchase prices exceeding $1 billion—has also been accelerating. In the United States, mergers of this size averaged twenty per year in the early 1990s, then climbed steadily to 208 in 2000. During the “merger mania” of the 1980s, the two largest transactions were the $13 billion takeover of Gulf Oil by Standard of California (1984) and the $25 billion “leveraged buyout” of RJR Nabisco (1988), which used borrowed money to buy up the outstanding stock of the company and take it private so it could be sold piece by piece, thought to be worth more that way than together as one company. In 1998-2000, the ten largest M&As averaged $76 billion each (see table 1), with value based on the price finally paid to shareholders of the acquired company in the form of cash, stock or bonds of the new company, or other financial instruments. The top transactions of 1998-2000 also indicate that, as with all merger waves, this one may be moving past its prime, as the U.S. economy runs out of steam from the “New Economy” boom of the 1990s. Only seven of the twenty-five deals were concluded in 2000, and both the number and total value of M&As dropped off in the last half of the year, falling well below their 1999 levels.2
The newest merger wave is the fifth in the past hundred-odd years, with similarities to merger movements past, but significant differences too, both of which pose threats to progressive and democratic forces the world over.
Past is Prologue: A Century of M&As
Three types of mergers and acquisitions have developed since the 1890s. Horizontal mergers bring together two or more companies competing in the same market (two automobile manufacturers or two supermarket chains, for example). Vertical mergers join companies at different stages of the same production process, previously in buyer-seller relationships (iron ore and steel); and conglomerate mergers occur when the merging companies operate in unrelated industries. All three tend to increase aggregate concentration in the economy, because they bring a greater volume of sales and assets under the control of one business firm. But they may have different effects on the industry or industries involved: the most dangerous type for its competition-reducing effects is the horizontal variety, because it directly increases the share of a given market in the hands of one firm.3
The first U.S. merger wave began in the early 1890s and culminated in 1898-1902, probably the most intense period of merger activity in history relative to the size of the economy. Vertical and horizontal mergers were widespread, but the more common, certainly the more significant, was the horizontal integration of leading producers in the same industry, creating a number of lasting dominant firms (Du Pont, U.S. Rubber, U.S. Steel, General Electric, Coca Cola, National Biscuit, and others). This historic consolidation of U.S. industry—representing the rise of modern-day corporate capital—grew out of, and accompanied, the formation of a nationwide market between 1870 and 1900, with the railroad and telegraph making it possible for large companies to produce and distribute their goods across the continent.
Four more merger waves have followed since 1902. The second ran from 1916 to 1929, characterized by horizontal mergers of secondary firms, especially in banking, retailing, steel, chemicals, and food products. It tightened the now-familiar structure of oligopoly, in which a handful of firms dominate a given industry. Speculative motives propelled this wave, as well as its predecessor, with financial promoters and corporate officers ripping off quick gains from the rising values of the common stock of companies targeted for merger and takeover.4
The third merger wave stretched from the mid-1950s to 1969, and peaked during the “go-go” boom of 1962-1969, when 60 percent of all mergers were of the conglomerate type. Medium-size companies that often got started in the rapidly expanding electronics industry or military contracting or both gobbled up firms in unrelated industries. International Telephone and Telegraph, Ling-Temco-Vought, Gulf and Western, and Litton Industries all made unrelated acquisitions totaling $1 billion or more.
The fourth wave brought the then-giant M&A deals of the 1980s. Changes in government policy toward business spurred the new generation of merger makers. The Carter administration deregulated airlines, trucking, natural gas, and banking; the Reagan administration extended deregulation to the telephone industry and openly relaxed antitrust policies in the face of hostile takeovers and leveraged buyouts. Sensing the lower likelihood of government challenge under the antitrust laws, companies carried out horizontal mergers that would have been inconceivable under prior administrations, reducing competition markedly in retailing, food and beverages, chemicals, and oil.
The New Merger Wave: Capital Goes Global
The fourth merger movement subsided during the recession of 1990-1991, but around 1994 another boom began, so large that it must be considered a fifth wave. Its pattern is eerily similar to the century-ago wave of the 1890s. Both were strongly affected by new technologies and a favorable public policy environment, with corporate capital today benefiting from liberalization of world trade and investment, deregulation of financial institutions and telecommunications, and privatization of state-run enterprises on all continents. And if the first wave followed the emergence of a nationwide market for goods in the United States, the fifth is riding on the globalization of the world economy, with plunging costs of collecting and processing information helping to make cross-border acquisition and control feasible, therefore imperative in corporate strategy. These global mergers are bringing about concentration and centralization of firms on a global scale and the closer integration of the world capitalist system.
Unlike those of the 1980s, the current mergers are financed primarily with corporate stock, not borrowed money, and companies are not being broken into pieces for sale but are merging to enlarge their size. Today’s M&As are based on long-term strategic and economic motives. This involves acquiring the scale and resources to compete at home and abroad, protecting and enlarging market share, reducing competition and attaining greater pricing power, in what large corporations see increasingly, often primarily, as a global market.
But short-term gains are important too, as in the past. Excess productive capacity is a recurrent feature of oligopoly, and it is growing on a worldwide basis, notably (but not exclusively) in banking, retailing and clothing, fast foods, automobiles, airlines, hotels, movie theater chains, computers, telecommunications, and electrical appliances. Even when it does not create an oversupply of goods relative to consumer demand, it can prevent companies from raising prices, and during economic contractions may exert downward pressure on prices at the worst possible moment. Either way, excess capacity squeezes profitability, and mergers and takeovers are effective ways to reduce it, if temporarily, by shedding labor and closing down less profitable facilities.
Another short-term incentive is the payoff for top executives, for whom M&As have become an almost no-lose proposition, and a lucrative one. The 1999 deal linking his company with Qwest brought US West CEO Sol Trujillo $15 million in severance, and $46 million in stock options along with $11 million to cover taxes on them, a guarantee he had set up for himself while negotiating with various corporate suitors. He also received 300,000 shares of restricted stock in Qwest (worth $24 million at the time of the deal). Qwest CEO Joseph Nacchio, for his part, got stock options worth $160 million and a $26 million “growth share” payment. Similar tales accompany nearly every big merger. The AOL-Time Warner deal generated stock option bonanzas for AOL boss Steve Case, his deputy Robert Pittman, and TW’s top five executives, totaling an estimated $3 billion.5
For the entire decade of the 1990s, the leading industries in M&A activity, in terms of transaction value, were banking, telecommunications, oil and gas, and radio and TV stations, with increasing ties developing between the second and fourth.6 The pattern continued through 1998-2000, when eleven of the twenty-five largest M&As were in telecommunications, the core industry of the “New Economy” (see table), and six more were in the financial sector, including banking and insurance. Virtually all of the top twenty-five were horizontal in nature, although the distinctions among the three merger categories are becoming less clear-cut.
Telecommunications giants are investing in what appear to be different lines of business but are increasingly linked segments of the same evolving industry—telephone, radio broadcasting, television, internet, cable systems, cable channels. Deutsche Telekom’s purchase of relatively tiny VoiceStream Wireless (only 2.2 million subscribers and $1 billion in revenue—small change compared with AT&T Wireless or Sprint) for a hefty $42 billion illustrates what is going on.7 The German company is not just buying a business in the United States but also the potential to become a dominant player globally. The acquisition is part of a fight to achieve economies of scale and market share as telecommunications giants jockey for position in the coming world of wireless web services. The booming stock markets of 1994-1999 have also contributed to the telecommunication merger spree. The surging price of AOL’s stock, for example, allowed it to swallow the much larger Time Warner in January 2000 in a merger valued at $166 billion at the time, although the subsequent decline in AOL stock reduced the deal’s value to $106 billion when concluded a year later.
Cross-border M&As involving U.S. companies set records in 1998-2000. In five of the twenty-five largest mergers, the buyers were foreign firms (three British, two German). While purchases of foreign companies by U.S. firms declined during 2000, foreign buyers of U.S. companies stepped up their activity, with acquisitions worth $302 billion (11 percent greater than in 1999).8 The Vodafone and Deutsche Telekom takeovers (see table) represent a further step in consolidation of the world telecommunications industry, as the other three (two by BP, the other by Daimler Benz) do in the automobile-oil complex. In Europe, the value of M&As has run very close to U.S. levels.9 To date, the 2000 takeover of the German telecommunications giant Mannesmann by the U.K.’s Vodafone Airtouch, valued at $183 billion, is the biggest on record. Vodafone itself was the result of the U.K. takeover noted above; and Mannesmann’s position in telecommunications had just been reinforced by its acquisitions of Orange PLC (UK) and part of Olivetti in 1999 for a total of $41 billion. In cross-border deals too, horizontal mergers like these have been increasing relative to both vertical and conglomerate; in value terms they now constitute more than 70 percent of M&As worldwide, compared to 53 percent in 1987.10
Strengthening the concentration effects of the new mergers are strategic alliances among large corporations. These take many forms—joint research and product development, joint manufacturing, marketing and distribution agreements, licensing and franchising contracts, and technical assistance. For firms based in North America, Europe, and Japan, annual numbers of new collaborations doubled in the 1980s and increased even faster during the 1990s.11 In telecommunications, AT&T and British Telecom pooled most of their international operations in 1998 in a jointly owned company with revenues of $10 billion to capture more of the corporate business market, a sign that not even the biggest communications giants feel big enough to go it alone in the global marketplace.12 Among other industries involved in international partnerships are oil (Shell and Texaco), automobiles (Toyota and General Motors), aluminum (Alcoa and Kobe Steel of Japan), semiconductors (IBM, Siemens, and Toshiba), and financial services (American Express and Tata of India).
Particularly ominous are the cartel-like arrangements in the airline industry. Following the deregulation of 1978, U.S. companies formed partnerships with several foreign airlines—American with Swiss Air, Delta with Aer Lingus and Air France, US Airways with British Airways, and others. By the late 1990s four international alliances accounted for 80 percent of all revenue passenger kilometers (RPKs). The “Oneworld Alliance” alone included American Airways, British Airways, Canadian Airways, Cathay Pacific, Iberia, JAI, Quantas, and US Airways and took in 28 percent of all RPKs.13 In an example from another industry, all the world’s major microchip manufacturers and equipment suppliers attended several meetings during the 1990s to chart an “international technology road map for semiconductors.”14 If cross-border mergers are hard to regulate and control, strategic alliances like these are no easier, particularly since they can often lay claim to common pooling of risks and greater efficiencies, which should bring benefits for consumers—but seem more likely to produce bigger profits, and more effective control over industrial conditions, for the companies involved and their shareholders.
Concentration: The More Things Change…
From 1939 to 1980, overall market competition increased in the United States, according to University of Massachusetts economist William Shepherd, although the trend was not uniform in all sectors of the economy.15 The causes were growing competition from imports, antitrust actions by the federal government, and deregulation in banking, telephone service and equipment, railroads, airlines and trucking. Over the past two decades, however, a reversal has taken place, with concentration on the rise across most sectors. The major reason is the cumulative effects of back-to-back merger waves—the fourth and fifth in U.S. history.
The latest data available show that in the manufacturing sector the four largest companies in a given industry controlled an average of 40 percent of the industry’s output in 1992, and the top eight had 52 percent. These shares were practically unchanged from 1972, but they are two percentage points higher than in 1982. Retail trade (department stores, food stores, apparel, furniture, building materials and home supplies, eating and drinking places, and other retail industries) also showed a jump in market concentration since the early 1980s. The top four firms accounted for an average of 16 percent of the retail industry’s sales in 1982 and 20 percent in 1992; for the eight largest, the average industry share rose from 22 to 28 percent.16 Some figures now available for 1997 suggest that concentration continued to increase during the 1990s; of total sales receipts in the overall economy, companies with 2,500 employees or more took in 47 percent in 1997, compared with 42 percent in 1992.17
In the financial sector, the number of commercial banks fell 30 percent between 1990 and 1999, while the ten largest were increasing their share of loans and other industry assets from 26 to 45 percent.18 It is well established that other sectors, including agriculture and telecommunications, have also become more concentrated in the 1980s and 1990s. The overall rise in concentration has not been great—although the new wave may yet make a major mark—but the upward drift has taken place from a starting point of highly concentrated economic power across the economy.
It is also remarkable that concentration keeps increasing, given three powerful forces that have had the opposite effect over time.
One force, probably the most important, is the continual rise of new industries and new markets, and the decline of older ones, stemming from technological changes. Giants like Microsoft and WorldCom barely existed, if at all, 20 years ago; nor did firms like Wal-Mart and Home Depot in “older” industries. New industries are born, but they soon follow the same cycle: headlong expansion with scores of new companies rushing to get in on the ground floor, an ensuing round of shakeouts featured by failures, mergers, and takeovers, and eventually an era of relative stability and uneasy coexistence among oligopolistic rivals. The automobile, aircraft, oil, chemical, and electronic industries—the core of today’s “old economy”—all went through this cycle. At present telecommunications and e-commerce are evolving along the same lines, with biotech not far behind.
The two other forces that have tended to curb concentration are imports and antitrust action. But in the age of globalization, imports do not always work this way, and antitrust may be losing its effectiveness.
If imports into the United States come from foreign affiliates of U.S. multinational corporations, or from foreign contractors doing “outsourced” work for U.S. multinationals which sell the finished product at home under their own brand names (Nike, K-Mart, Compaq Computer), these imports lead to less competition, not more. At present such imports account for a quarter of all U.S. merchandise imports. Another 23 percent comes at the behest of U.S. affiliates of foreign multinationals (Toyota, Michelin Tire, Unilever), which also dampens competition or limits it to that prevailing among international oligopolies pursuing similar strategies.19
Antitrust action, already limited in its effectiveness, is likely to be less so in a globalizing economy. The case can be made that firms must be larger to compete with their counterparts both abroad and at home, since foreign competition in domestic markets must be taken into account. The basic problem in dealing with giant multinationals on any grounds, however, is that the economic and political force of capital is becoming global, while regulatory authority remains national. Only cooperative enforcement among nations would appear to hold out any hope for effective regulation of a variety of business practices and initiatives. There are some signs of this, with the U.S. Justice Department and the European Union’s Competition Commission (EUCC) cooperating in the U.S. antitrust action against Microsoft, and in the review of the AOL-Time Warner merger. The EUCC also blocked WorldCom’s planned $116 billion combination with Sprint in June 2000, shortly after it forced Sweden’s two big truck manufacturers, Volvo and Scania, to drop their merger plans.20 But multinationals are continuing to acquire companies everywhere, including developing countries where privatization (especially in Latin America and Eastern Europe) and financial crisis (in Asia) have encouraged them to swoop in and buy up assets at fire sale prices. It is doubtful that national or global antitrust actions will have much effect on this kind of aggressive M&A activity.
The New Concentration: Early Returns
Neither the goals of the new merger makers nor the early performance returns of their creations bode well for workers, consumers, and the large majority of people with minimal or no stock ownership.
The airline industry was a poster-boy for deregulation in 1978; soon it became a model for how free and unregulated markets evolve toward oligopolistic concentration. By 1987 the six largest carriers controlled 85 percent of the market compared with 73 percent in 1978 and were increasing fares across the board. In 1998 the top six’s share was 86 percent, but effectively higher with three code-sharing alliances now linking all six in pairs.21 A new round of mergers in 2001, with United seeking to acquire US Airways and American buying TWA, threatens to reduce the number of dominant firms to three (United, American, and Delta). If United and American both become larger, Delta warns that it might take over Continental to avoid being put at a competitive disadvantage. Even before these imminent mergers are carried out, the airline industry is displaying less competition, elevated prices, and sharply deteriorated passenger service. In measures of consumer dissatisfaction over the past seven years, no industry matches the airlines, but banking comes close.22
Contrary to the expectation that deregulation of banking markets and new technologies in the industry would increase competition and benefit consumers, bank mergers have tightened concentration levels in local markets, raised interest rates for loan customers, and lowered rates on local deposit accounts. This is partly a result of greater market power, but it also reflects the fee rates of big multistate banks (15 to 20 percent higher than smaller banks) and their disinterest in serving poor and middle-class consumers, as opposed to business and upscale customers. An example is FleetBoston Financial, which alone has 28 percent of the retail market in New England but derives only 18 percent of its profits from retail banking. Focusing on markets with greater profit potential, its retail customers “are forced to accept higher prices and lower-quality service.”23 A New York Federal Reserve study shows that the rapid growth in the market share of major banks is almost entirely due to M&As; antitrust authorities simply looked the other way, even though such mergers produce no efficiency gains that might offset some of the damage to competition.24
Paper industry mergers have been openly designed “to restore” fallen prices to levels that provided “a more reasonable return to producers.…The goal is getting to a certain level and staying there,” states industry executive Patrick Moore. And in the corrugated-box industry, consolidation has facilitated a 15 percent cut in capacity and a 43 percent rise in prices.25 Drug industry mergers have been justified on the ground of economies of scale, especially in the research essential to the industry. But Pfizer’s hostile takeover of Warner-Lambert was based on strategic market considerations—fear that a rival takeover might end its co-marketing arrangement with Warner-Lambert in selling the high-flying anti-cholesterol drug Lipitor, and desire to maintain profit-generating growth in the face of a dwindling product lineup.26 Furthermore, consolidating drug research reduces the number of independent sources of that research and conflicts with the public’s interest in a high rate of important drug innovations, which have come disproportionately from small labs. In all, these mergers will reduce the number of active firms in the industry and increase market power with no offset that might benefit consumers.
The merger wave has swept into farming and food. In 1996 the Clinton-Gore “Freedom to Farm Act” liberated the sector from price controls, but continued annual subsidies, $28 billion in 2000, for a seven-year term instead of the traditional five years. It retained the sugar, peanut, and dairy programs that keep consumer prices high. Of the $1.4 billion in sugar price supports, 40 percent goes to the largest 1 percent of producers, a concentration ratio typical of all government subsidies to the farm sector.27 The Act furthered the exodus of small farmers (who called it “The Freedom to Fail Act”), and set the stage for a more capital-intensive agriculture controlled by agribusiness corporations like Archer Daniels Midland, ConAgra, and Cargill/Monsanto. Numerous mergers and cross-ownership investments in grain farming and processing, in beefpacking and cattle feedlots, in hog and chicken growing and processing, and in biotech and seeds have also put independent farmers at a bargaining disadvantage and made many into captive and contracted suppliers. Spreads between prices paid for livestock and wholesale prices of meat have widened greatly in recent years. And growing concentration of supermarket chains (four firms control over 70 percent of the market in 94 large cities) helps assure that consumers will not be benefiting from these developments.28
In the 1983 edition of his book The Media Monopoly, Ben Bagdikian estimated that fifty firms dominated the mass media; in his 2000 edition, the number had fallen below ten. The jumbo deals of the 1990s have centralized the media in nine transnational conglomerates—Disney, Time Warner, Viacom, News Corporation, Bertelsmann, General Electric (owner of NBC), Sony, AT&T–Liberty Media, and Vivendi Universal. These giants own all major film studios, TV networks, and recorded music companies, most cable channels, cable systems, magazines, major market TV stations, and book publishers; and they have joint ventures and other strategic alliances among themselves and with other media entities. Here too lines between industries—communications and media—are breaking down, blurring any conglomerate or vertical tinge that mergers may appear to have. These giant companies not only have market power; their focus on entertainment rather than on serious news reporting and discussion of public issues, and their unified cultural and political values, raise dire questions about their role in a democracy.
Even the much-proclaimed “efficiency enhancement” goal of the mergers has not been realized. Many of them have been hastily cobbled together by firms fearing they would be passed by in a consolidation process or frozen out of new markets. Others have been promoted by leaders seeking a fast track to “growth.”
This is anything but new. The history of the first four merger waves is one of over-hyped deals promising greater efficiencies and profitability, but producing sub-par financial returns for shareholders, outright failures, and subsequent sell-off of acquired firms.29 The “conglomerate” mergers of the 1960s were supposed to create “synergies”: firms from unrelated industries would be worth more than the sum of their parts once brought together under a new breed of managers. But most of these mergers had “efficiency losses substantially exceeding identifiable gains,” and more than half the acquired firms were divested over the following decade.30 Two studies for 1979-1990 and 1990-1995 show similar results. The first found that “fully 65 percent” of 168 major acquisitions were failures; the second, covering 150 deals each valued at $500 million or more, found that half “destroyed shareholder wealth” and another third contributed only marginally to it.31
In the current wave, Daimler-Benz’s takeover of Chrysler is in chaos, with recriminations flying both ways across the Atlantic: “This 1998 model is looking more like a lemon.”32 AlliedSignal’s purchase of Honeywell, Conseco’s acquisition of Green Tree Financial, and mergers joining First Union and Core States banks, McKesson and medical software maker HBO, CSX–Norfolk Southern and Conrail, Union Pacific and Southern Pacific, and Quaker Oats and Snapple appear to be economic failures.33 In a two-week period in late 2000, AT&T, WorldCom, and British Telecommunications all announced split-ups and divestitures of expensive acquisitions that also proved unworkable. For AT&T, it marked the second time in five years that it had split itself into separate companies.34 Meanwhile, telephone customers “don’t seem to gain much from consolidation,” except slamming, cramming, hidden fees, and poorer service.35
Thinking About Tomorrow
Concentration, by magnifying the power of dominant corporations, diminishes the possibility that citizen voices will be heard in the management of public business. In a rare article on this subject in a large-circulation outlet, Jeffrey Garten, Dean of the Yale School of Management, noted that the emerging giant companies will be unlikely to focus on rebuilding decaying neighborhoods or training potential workers; that “big companies have disproportionate clout on national legislation,” have become too large to be allowed to fail, “exert massive pressure on America’s international behavior,” and “already [have a] formidable grip on U.S. trade policy.”36
Clearly, the new wave of concentration has political and social as well as economic consequences. It rests in part on the growing political power of capital in the New World Order, and it reinforces that power. The increasing strength of capital is also reflected in the way that mainstream economists and media simply take the growth of concentration and centralization of economic power as a “given” and ignore how it contributes to the exploding inequalities of income and wealth and, in the United States, to the conversion of the major political parties into mailboxes for corporate money.
Older ideals of a link between economic and political democracy have faded in the face of raw economic power and the new realities. Populist politics of hostility to great concentrations of economic power are now considered quaint, or are attacked as “class warfare” (presumably being waged against the beleaguered rich and large corporations). Warnings in 1912 by Louis Brandeis (later appointed to the U.S. Supreme Court) about the economic and social effects of giant corporations “in a country cursed with their bigness,” and extensive hearings on “Economic Concentration” and “Administered Prices” such as those held from 1957 onward by the Senate Subcommittee on Antitrust and Monopoly seem like relics of a bygone age.
Building genuine democracy in the United States—and elsewhere—is going to require not only a halt in ongoing concentration, but decentralization of the economic power that gives us plutocracy. Progressives must stress that concentration is incompatible with a democratic political order whatever its impact on economic efficiency, and strong evidence can also be put forth that the efficiency outcomes of mergers are often negative. But concentrated economic power is only one aspect of the reign of corporate capital. The fight for radical change must be carried to many fronts, from vigorous antitrust policies and opposition to further privatizations to rebuilding the nonmilitary public sector, including comprehensive environmental controls and safeguards and social insurance covering all age groups and all households. Only then will we begin to free ourselves from the iron grip of capital over so many aspects of our lives.
Notes
- United Nations, World Investment Report 2000(New York: United Nations, 2000), 10-14, 28; World Investment Report 1999 (New York: United Nations, 1999), 94-96.
- Mergerstat release, December 20, 2000.
- In this article “concentration” refers to the share of an industry’s output, employment, or assets held by a relatively small number of firms, usually four or eight (which is how the U.S. Census Bureau and Federal Trade Commission measure concentration). Marx called this “centralization,” as “the larger capitals beat the smaller….[I]n a certain line of industry [centralization] would have reached its extreme limit, if all the individual capitals invested in it would have been amalgamated into one single capital.” He used “concentration” to refer to the growth in the size of individual firms as “accumulation increases the concentration of that wealth [the means of production] in the hands of individual capitalists” (Capital, vol. I, Kerr ed., 685-688). The distinction, and the trends foreseen, represent a landmark in the history of economic analysis.
- See R. B. Du Boff and E. S. Herman, “The Promotional-Financial Dynamic of Merger Movements: A Historical Perspective,” Journal of Economic Issues 23 (March 1989).
- “Merger Prompts US West CEO to Call it Quits,” USA Today, March 1, 2000, 2B; “US West Execs Set Bonus for Trujillo, others to get $18.5 million,” Denver Post, March 14, 2000, C1; “Mergers: How Sweet They Can Be!,” Too Much, Winter 2000, 9.
- Martin Sikora, “A Decade of Dealmaking,” Mergers and Acquisitions Journal 35 (January/February 2000), 36-38.
- “Deutsche Telekom’s Wireless Wager,” Business Week, August 7, 2000.
- Mergerstat release, December 28, 2000.
- “The Big Grab,” Business Week, January 24, 2000; “Entreprises: après les Etats-Unis, la folie des fusions s’empare de l’Europe,” Le Monde, April 19, 1999, 18.
- World Investment Report 2000, 101-102.
- United Nations, World Investment Report 1997 (New York: United Nations, 1997), 12-15.
- “AT&T and British Telecom Merge Overseas Operations,” New York Times, July 28,1998, A1.
- “Airline Alliances: Mergers in Mind,” Economist, September 26, 1998, 68.
- See “Partners,” Business Week, October 25, 1999.
- W. G. Shepherd, “Causes of Increased Competition in the U.S. Economy, 1939-1980,” Review of Economics and Statistics 64 (November 1982).
- U.S. Census Bureau, Census of Manufactures, and Census of Retail Trade, various editions.
- U.S. Census Bureau, Economic Census 1997 at www.census.gov/epcd/www/concentration.html.
- Kevin Stiroh and Jennifer Poole, “Explaining the Rising Concentration of Banking Assets in the 1990s,” Federal Reserve Bank of New York, Current Issues 6 (August 2000), Table 1.
- Data from Survey of Current Business, various issues.
- “Why U.S. Giants Are Crying Uncle,” New York Times, October 11, 2000, W1.
- “Unexpected Result of Airline Decontrol is Return to Monopolies,” Wall Street Journal, July 20, 1987, A1; Amy Taub, “Oligopoly!” Multinational Monitor, November 1998, 9.
- “Why Service Stinks,” Business Week, October 23, 2000.
- “Bigger Isn’t Better for Fleet’s Customers,” Business Week, July 10, 2000.
- Stiroh and Poole, “Explaining Rising Concentration,” 4-5; Gerald Hanweck and Bernard Shull, “The Bank Merger Movement: efficiency, stability and competitive policy concerns,” Antitrust Bulletin 44 (Summer 1999), 263.
- “Paper Prices Are Driving Flurry of Industry Mergers,” Wall Street Journal, May 10, 2000, B4.
- “Pfizer Gets Its Deal to Buy Warner-Lambert for $90.2 Billion,” New York Times, February 8, 2000, C1.
- “Farm Subsidies,” Environmental Working Group, at www.ewg.org.
- William Greider, “The Last Farm Crisis,” The Nation, November 20, 2000, 14; Michael Stumo, “In Firm Control,” Multinational Monitor, July/August 2000.
- See Du Boff and Herman, “Promotional-Financial Dynamic of Merger Movements.”
- David Ravenscraft and F. M. Scherer, Mergers, Sell-Offs, and Economic Efficiency (Washington: Brookings Institution, 1987), 38-45, 207-217.
- Mark Sirower, The Synergy Trap (New York: Free Press, 1997), 11-17, 123-136; “The Case Against Mergers,” Business Week, October 30, 1995.
- New York Times, November 26, 2000, BU1; also, “Unmaking Mistake . Daimler’s New Boss For Chrysler Orders Tough, Major Repairs,” Wall Street Journal, January 22, 2001, A1.
- “Let’s Talk Turkeys,” Business Week, December 11, 2000; “Cautionary Tales: When Big Deals Turn Bad,” Wall Street Journal, December 8, 1999, C1.
- For reports on these splits, see New York Times, November 10, 2000, C1 (British Telecom); November 2, 2000, C1 (WorldCom); October 26, 2000, A1 and September 21, 1995, A1 (AT&T).
- “Big Mergers, Bad Service,” Business Week, August 10, 1998. “Cramming” is billing customers for fraudulent services or products; “slamming” is switching them to a new long-distance company without their knowledge.
- “Megamergers Are a Clear and Present Danger,” Business Week, January 25, 1999.
Comments are closed.